Display problem ? Click HERE

A crude transfer pump with capacity of 500 gpm and pump head of 400 ft pumping crude with viscosity of 88 centistokes. With these basic information, Process engineer will prepare a pump specification. Together with other mechanical requirements, all these documents will be submitted to pump vendor for pump quotation. After proper pump selection, pump vendor will submit the quotation with pump curve. The curve indicating performance curve for water instead of crude. The marked operating point on the curve (water) are capacity of 505 gpm, pump head of 417 ft and pump efficiency of 75%. Is the selected pump acceptable ?
Obviously the pump performance curve for water can not be make equivalent to performance when pumping crude with viscosity of 88 centistokes. With following correction charts, the capacity, head and efficiency when pumping crude with identical pump can be found.
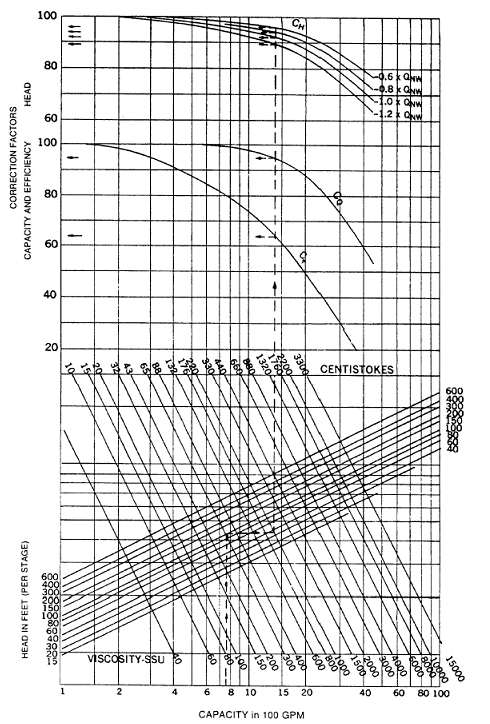 Chart 1 : Correction chart for flow in the range of 100 gpm - 10000 gpm
(Click to view larger chart)
 Chart 1 : Correction chart for flow in the range of 10 gpm - 100 gpm
(Click to view larger chart)
- Capacity correction = 0.99
- Head correction = 0.96
- Efficiency correction = 0.8
The corrected pump capacity when pumping crude @ 88 cSt = 0.99 x 510 gpm = 500 gpm.
The corrected pump head when pumping crude @ 88 cSt = 0.96 x 417 ft = 400 ft.
Above indicated the selected pump is acceptable.
When calculating the pump shaft power, the pump efficiency shall be corrected by multiplying the efficiency obtain from pump curve (water) with efficiency correction.
Related Topic
No comments:
Post a Comment